The Town of Newmarket collects and analyzes cycling volumes to monitor the usage and trends of users and to plan further bike lanes. The first bicycle count too place in the fall of 2017 following the completion of the East-West Bikeway.
Disclaimer
The bike lane usage numbers data provided on this website is intended for informational purposes only. While every effort has been made to ensure the accuracy and veracity of the information on this website, the Corporation of the Town of Newmarket (the Town) does not warrant the quality, accuracy, reliability, or completeness of any information on this website. Such information is provided "as is," without warranty or condition of any kind. The Town reserves the right to discontinue, change, or modify this site at any time without notice.
By using this website and accessing the bike lane usage numbers data, you acknowledge that the information presented may contain inaccuracies, omissions, or typographical errors. Additionally, you acknowledge that you have read, understood, and agreed to this disclaimer. Therefore, you agree that the usage of this information is at your own risk, and the Town is not responsible for any damages or losses that may arise from its use.
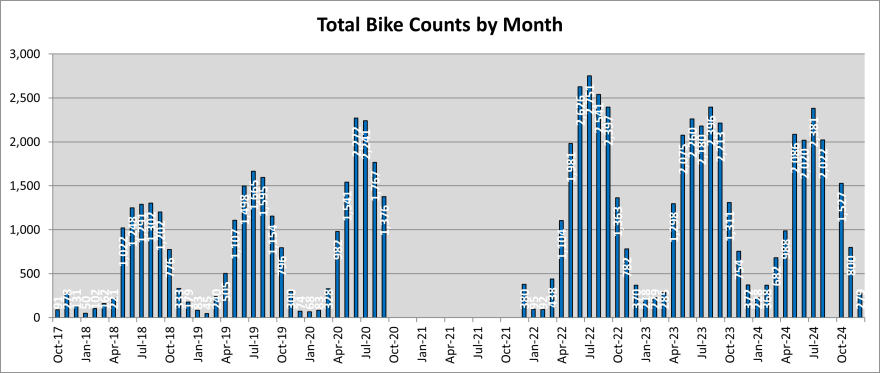
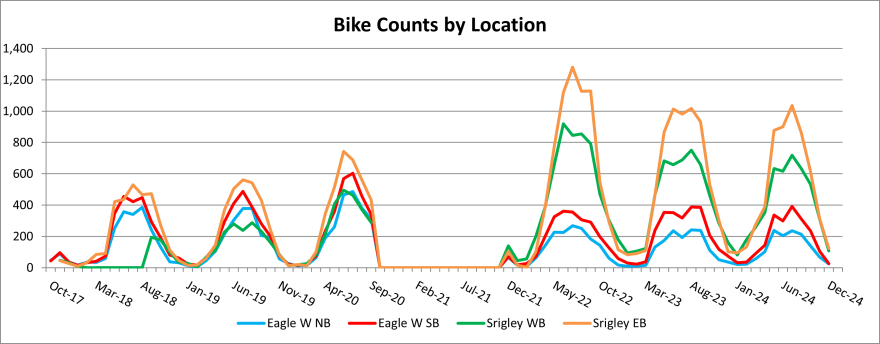
| Month | Eagle Street West Northbound | Eagle Street West Southbound | Srigley Street Westbound | Srigley Street Eastbound | Totals by Month |
|---|---|---|---|---|---|
| January 2023 | 9 | 30 | 95 | 84 | 218 |
| February 2023 | 11 | 22 | 105 | 91 | 229 |
| March 2023 | 16 | 37 | 123 | 109 | 285 |
| April 2023 | 132 | 238 | 465 | 463 | 1,298 |
| May 2023 | 174 | 353 | 682 | 866 | 2,075 |
| June 2023 | 236 | 352 | 658 | 1,014 | 2,260 |
| July 2023 | 192 | 318 | 689 | 981 | 2,180 |
| August 2023 | 242 | 387 | 750 | 1,017 | 2,396 |
| September 2023 | 238 | 385 | 658 | 932 | 2,213 |
| October 2023 | 111 | 206 | 462 | 532 | 1,311 |
| November 2023 | 51 | 118 | 283 | 302 | 754 |
| December 2023 | 35 | 74 | 160 | 103 | 372 |
| January 2024 | 21 | 32 | 81 | 94 | 228 |
| February 2024 | 22 | 35 | 179 | 132 | 368 |
| March 2024 | 57 | 90 | 259 | 276 | 682 |
| April 2024 | 102 | 144 | 352 | 390 | 988 |
| May 2024 | 239 | 336 | 633 | 878 | 2,086 |
| June 2024 | 205 | 299 | 616 | 900 | 2,020 |
| July 2024 | 236 | 391 | 718 | 1,036 | 2,381 |
| August 2024 | 213 | 312 | 634 | 863 | 2,022 |
| September 2024 | 210 | 312 | 596 | 872 | 1,990 |
| October 2024 | 139 | 237 | 534 | 617 | 1,527 |
| November 2024 | 69 | 106 | 311 | 314 | 800 |
| December 2024 | 24 | 26 | 107 | 122 | 279 |
The data between February and August 2018 from Srigley Street westbound, and the data between October 2020 and November 2021 from all locations is not available due to the sensor misinterpretation.